Bay Area ADU Permits by City, 2018 to 2025
· 5 min read
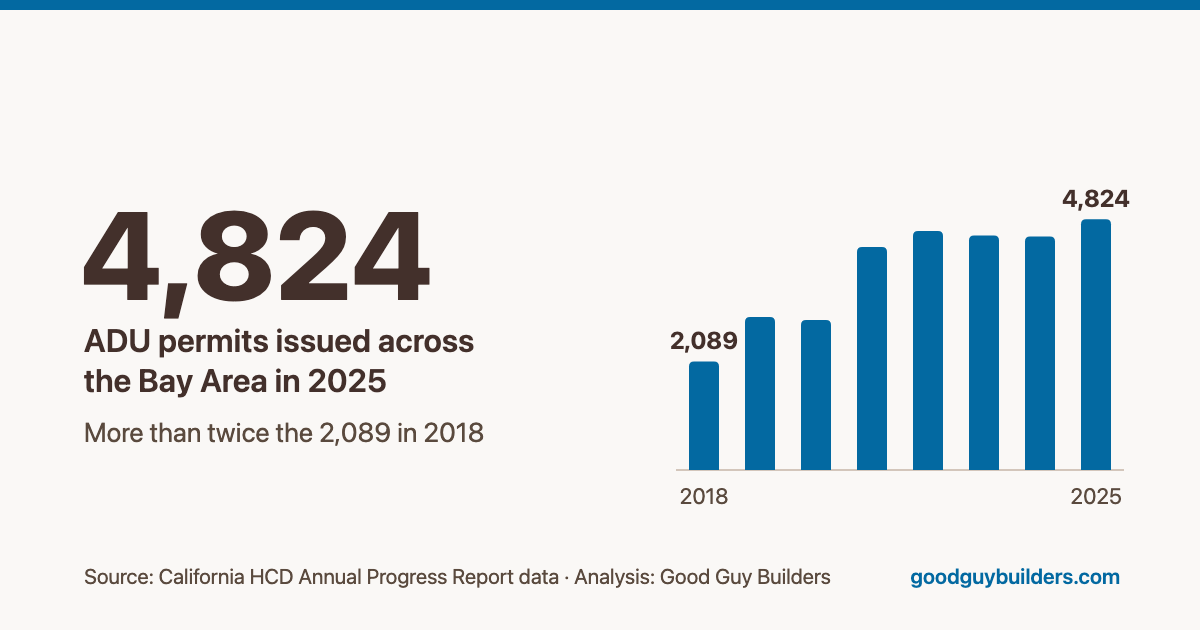
Bay Area cities and counties issued building permits for 4,824 accessory dwelling units (ADUs) in 2025. That's more than twice the 2,089 they permitted in 2018, and nearly one in four of all the new homes permitted in the region last year.
We counted every ADU permit that the 109 cities and counties in the nine-county Bay Area reported to the state from 2018 through 2025, once each, in the year it was issued. You can look up your city below, download the full table, and see exactly how we counted at the end.
Show the numbers
| Year | ADU permits | All new homes permitted | ADU share |
|---|---|---|---|
| 2018 | 2,089 | 30,347 | 6.9% |
| 2019 | 2,943 | 27,768 | 10.6% |
| 2020 | 2,882 | 23,979 | 12.0% |
| 2021 | 4,289 | 26,048 | 16.5% |
| 2022 | 4,598 | 29,472 | 15.6% |
| 2023 | 4,510 | 23,342 | 19.3% |
| 2024 | 4,489 | 15,757 | 28.5% |
| 2025 | 4,824 | 20,524 | 23.5% |
What the numbers show
- ADU permits have more than doubled. The region permitted 2,089 ADUs in 2018 and 4,824 in 2025, the highest yearly total in the data.
- About one in four new homes is now an ADU. ADUs were 7% of all homes permitted in 2018 and 24% in 2025. The share peaked at 28.5% in 2024, a year when total home permits dropped to 15,757.
- San Jose permits the most. The city issued 502 ADU permits in 2025 and 3,337 since 2018, more than any other city in the region.
- Santa Clara County is growing fastest. Its cities and unincorporated areas went from 417 ADU permits in 2018 to 1,575 in 2025, nearly four times as many.
- San Francisco is going the other way. The city permitted 483 ADUs in 2019 and 171 in 2025. ADUs were 9% of the homes San Francisco permitted in 2025, tied with Solano County for the lowest share in the region.
- In Marin, most new homes are ADUs. Of the 300 homes permitted in Marin County in 2025, 240 (80%) were ADUs. In nine places, from Colma (one home) to Foster City (26), every home permitted in 2025 was an ADU.
ADU permits by county
| County | 2018 | 2025 | 2018–2025 | ADU share of new homes, 2025 |
|---|---|---|---|---|
| Alameda | 474 | 1,060 | 6,486 | 27% |
| Contra Costa | 208 | 584 | 3,380 | 32% |
| Marin | 96 | 240 | 1,472 | 80% |
| Napa | 53 | 123 | 692 | 28% |
| San Francisco | 272 | 171 | 2,356 | 9% |
| San Mateo | 261 | 715 | 4,642 | 20% |
| Santa Clara | 417 | 1,575 | 8,681 | 29% |
| Solano | 53 | 120 | 775 | 9% |
| Sonoma | 255 | 236 | 2,140 | 13% |
| Bay Area | 2,089 | 4,824 | 30,624 | 24% |
Napa and Sonoma
Napa County permitted 123 ADUs in 2025, up from 53 in 2018. The city of Napa issued 73 of them, and ADUs made up 45% of all the homes the city permitted that year.
Sonoma County permitted 236 ADUs in 2025, slightly fewer than the 255 in 2018. Unincorporated Sonoma County issued the most (110). Santa Rosa's ADU permits peaked at 154 in 2023 and fell to 47 in 2025.
Look up your city
Search for your city or pick a county, and select a column heading to sort. The share of new homes combines 2023 through 2025, because in a small town one or two projects can swing a single year.
| San JoseSanta Clara County | 192 | 502 | 20% |
|---|---|---|---|
| OaklandAlameda County | 252 | 192 | 25% |
| FremontAlameda County | 34 | 188 | 29% |
| San FranciscoSan Francisco County | 272 | 171 | 11% |
| Santa ClaraSanta Clara County | 21 | 140 | 16% |
| Palo AltoSanta Clara County | 36 | 136 | 63% |
| Unincorporated Contra Costa CountyContra Costa County | 47 | 124 | 36% |
| SaratogaSanta Clara County | 16 | 119 | 60% |
| BerkeleyAlameda County | 81 | 117 | 19% |
| Unincorporated Sonoma CountySonoma County | 101 | 110 | 38% |
| SunnyvaleSanta Clara County | 30 | 107 | 22% |
| Unincorporated Alameda CountyAlameda County | 10 | 94 | 44% |
| San MateoSan Mateo County | 8 | 94 | 44% |
| Los AltosSanta Clara County | 8 | 89 | 43% |
| Mountain ViewSanta Clara County | 6 | 86 | 23% |
| Unincorporated Marin CountyMarin County | 15 | 85 | 55% |
| DublinAlameda County | 19 | 81 | 10% |
| Unincorporated Santa Clara CountySanta Clara County | 27 | 79 | 49% |
| NapaNapa County | 20 | 73 | 39% |
| RichmondContra Costa County | 48 | 71 | 48% |
| ConcordContra Costa County | 22 | 64 | 25% |
| Menlo ParkSan Mateo County | 15 | 63 | 56% |
| Redwood CitySan Mateo County | 26 | 63 | 17% |
| CupertinoSanta Clara County | 15 | 59 | 46% |
| LivermoreAlameda County | 18 | 58 | 12% |
What this means if you're planning an ADU
A low number doesn't mean your city won't approve one. State law requires every city and county to allow a detached ADU of at least 800 sq ft, and to approve or deny a complete application within 60 days when there's already a home on the lot. A high number tells you the building department reviews ADU plans often, but not how long plan check takes in practice.
Our ADU page covers what state law allows, costs published by public ADU programs and permit notes for the cities we work in. If you're thinking about an ADU in the Bay Area or Napa Valley, send us a few details for a free consultation.
Use this data
You're welcome to use these numbers in articles, reports, newsletters and presentations. Please credit Good Guy Builders and link to this page.
- Download the city-by-city table (CSV): ADU permits and all home permits for each of the 109 cities and counties, by year, 2018 to 2025.
How we counted
- Source. California's Department of Housing and Community Development (HCD) publishes the housing permits each city and county reports in its Housing Element Annual Progress Report. We used Table A2 of HCD's dataset on data.ca.gov, last updated November 13, 2026.
- What counts. Units that cities reported in the state's ADU category and that received a building permit. A permit isn't a finished home, and some permitted ADUs are never built.
- Each permit once. Cities often list a permit again in a later year's report, for example when the ADU is finished. We counted each permit once, in the year it was issued, matching on the permit number (or the address when there's no number) and the issue date. Campbell's 2025 report, for example, lists 340 ADU permits, but 288 of them were issued between 2018 and 2024. That's why some figures here are lower than a city's own report for the same year, and why other published totals can differ: adding up the region's 2025 reports as filed gives 5,986 ADUs, while counting each permit once gives 4,824.
- Share of new homes. ADUs divided by all housing units permitted in the same year: single-family homes, apartments and condos, ADUs and mobile homes.
- Limits. The numbers are only as accurate as what each city reports, and cities sometimes file late or correct earlier years. We'll update this page after cities file their 2026 reports, which are due April 1, 2027.
Sources
- California HCD, Housing Element Annual Progress Report (APR) data by jurisdiction and year (Table A2, updated November 13, 2026)
- California HCD, ADU Handbook (March 2026) (800 sq ft minimum and the 60-day review deadline)